AdvisorStream's latest update makes it even easier to measure how your client engagement and marketing efforts are performing. Our new reporting dashboard gives you easy access to the key metrics you need to understand how your client engagement and marketing efforts are performing.
Let's check out the new dashboard below:
Easier Navigation and Improved User Experience
The new streamlined reporting dashboard makes it easy to view the metrics that help shape and grow your business.
Simply click on the type of communication you want to see in the report and filter by date, metric, or persona.
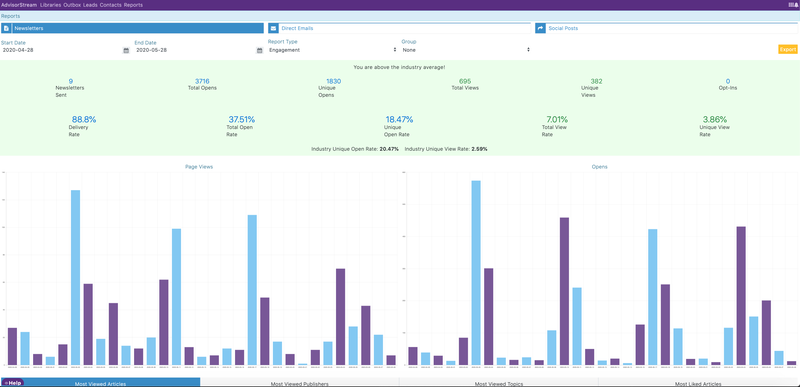
Get a Snapshot of Your Digital Performance
The reporting dashboard allows you to quickly see how your digital marketing efforts are performing- and how you stack up to the industry benchmarks. Get a snapshot of your open rates, view rates, and more.
Content is Still King
Want to know which article, publisher, or topic has the most views or engagement from your communications? The reporting dashboard seamlessly displays how your content is performing and can help you make better-informed marketing decisions.
Deep Dive into Your Communications
Are you interested in learning more about how a specific newsletter or social media post is performing? In just a click, you can delve further into any communication to see how it's performing, how many new prospects you generated from that specific content piece, and even who engaged with your newsletter or emails.
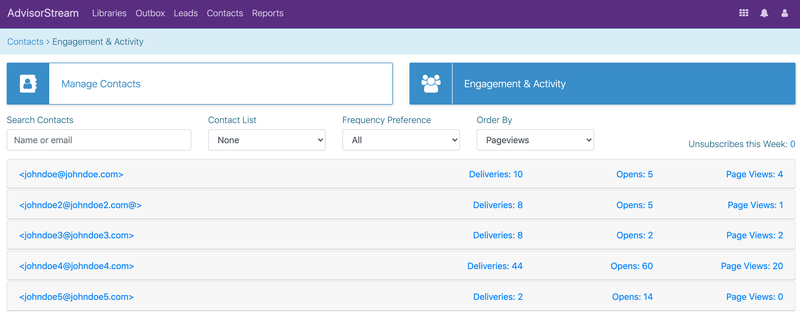
Even More Data: An Expanded Way to Manage Contacts
Store all your contact information in one place with easier contact management and reporting. Check out the view rates, open rates, and deliveries of your communications to each individual contact. Information can be found in the 'Contacts' tab on the navigation bar, with easy options to either manage your contacts or view engagement data.