

By Mellody Hobson and John W. Rogers Jr.
Dec. 11, 2020
There is a surreal quality to life these days. As the year began—which now seems so very long ago—the U.S. economy was humming: Unemployment was at a 50-year low; investors continued to benefit from the longest bull market in history; and with Chinese trade-war tensions subsiding, the 2020 outlook was promising.
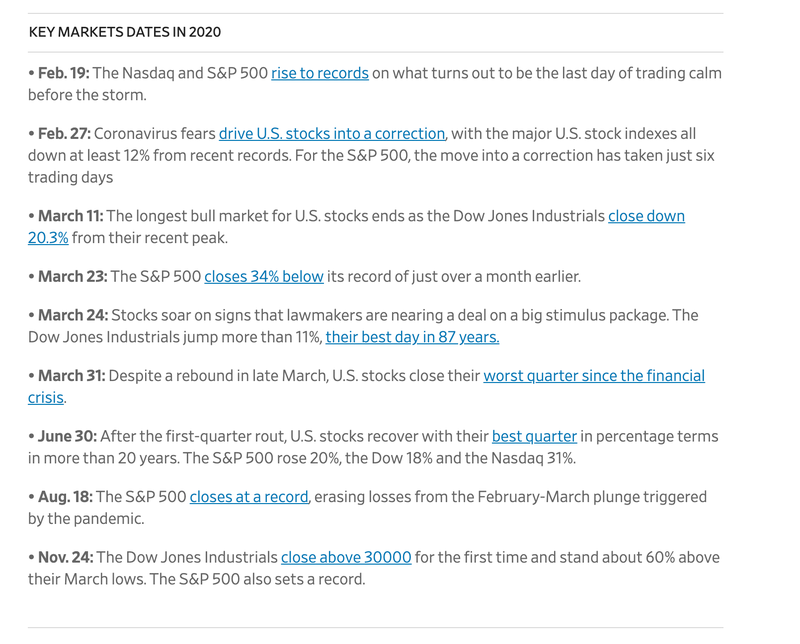
Then, the lights went out when a barely understood coronavirus instantly closed economies around the globe. Suddenly, most Americans were sheltering in place and nonessential businesses were forced to close. Records were smashed when nearly 10 million people filed for unemployment insurance in the second half of March, and the stock market seesawed from bull to bear status faster than any time in history—just 20 days.
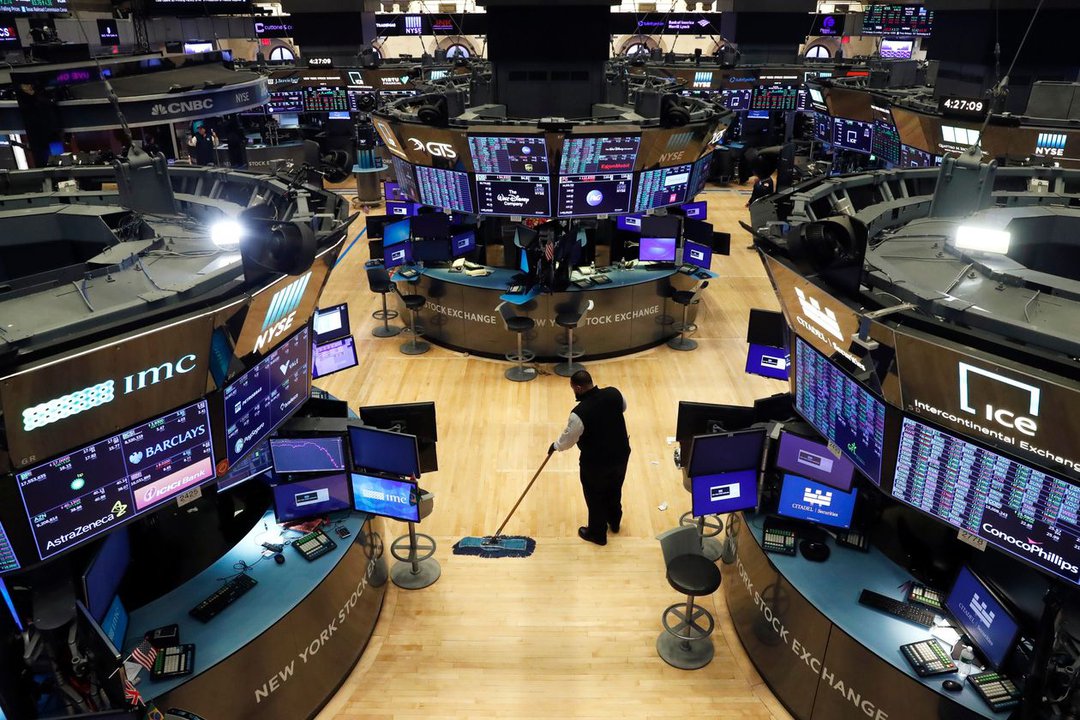
A worker cleaned at the New York Stock Exchange on March 19 after some traders tested positive for the coronavirus. Stocks were near their lows for the year. PHOTO: LUCAS JACKSON/REUTERS
While there were degrees of bloodletting, indiscriminate selling meant nothing was spared. By the end of the first quarter, the S&P 500 had fallen nearly 20%. Smaller companies plummeted over 30%. The only word to describe the environment is perhaps the most overused word of the year, “unprecedented.” This wasn’t the Great Depression or the Great Recession but something completely different. In the blink of an eye, companies had no revenue—zero. The global economy had been put in a medically induced coma. Financial models weren’t just distorted, they were broken.
How does one model in the absence of revenue, anyway?
A narrow ascent
Then, after a remarkable fall, stocks staged an even more remarkable comeback. The ascent, which began in late March, started to take hold in April and came to a stunning crescendo with the Dow Jones Industrial Average reaching new record highs and breaking through the 30000 barrier by November.
But a rising tide didn’t lift all boats. In fact, the biggest gainers weren’t boats at all, they were more like battleships. More specifically, the most popular stocks—Facebook, Amazon, Apple, Netflix, and Google parent Alphabet, along with Microsoft—benefited from earnings growth supercharged by a health crisis that kept us mostly at home glued to our phones and computers.
These companies, which are indeed essential to our daily lives, continue to be bid up beyond recognition. For example, Apple sports a $2 trillion market cap—$1 trillion of which was clocked in just 21 weeks this past summer. This rise is truly astounding when one considers it took 31 years for the company to cross the $100 billion mark. There was even a point when Apple’s market cap exceeded the combined value of all 2,000 of the smaller companies in the Russell 2000 index.
With today’s barely-there interest rates, nosebleed price/earnings multiples appear reasonable because the value of a dollar made in the future is roughly equivalent to the value of a dollar made today. Free money is distorting valuations. In previous market cycles, faster-growing small-cap stocks usually traded at higher multiples than big companies that were deemed safer but whose large size encumbered growth. But these days, we are witnessing one of the widest valuation gaps ever, with the S&P 500 selling for nearly 22 times forward earnings compared with almost 18 times for the Russell 2000 index and just 15 times for the even cheaper Russell 2000 Value index. Meanwhile, the “six” are selling for an average of 34 times next year’s earnings, with Amazon sporting the highest multiple at 70 times.
This period is eerily reminiscent of the 1970s, when the market’s performance was narrowly propelled by unbridled enthusiasm for 50 large companies that became known as the “Nifty 50.” Burton Malkiel discusses these “one decision” stocks in his investment classic, “A Random Walk Down Wall Street,” chiding, “Nothing could be more prudent than to buy their shares and then relax on the golf course.” With investors piling in, the most renowned and biggest American corporations traded at massive multiples—just like today. Once it became clear company fundamentals were completely disconnected from valuations, the bottom fell out and those coveted growth-stock darlings crashed.
Beware of swinging pendulums
But instead of 50, this time there are only six—another glaring pendulum that has swung too far. Most consider the S&P 500 a broad representation of large corporations across industries and thereby a de facto indicator of the health of the U.S. economy. But when six companies account for nearly 25% of the index and 77% of its gains over the 12 months through September, this high-octane growth-stock cluster isn’t your grandfather’s Oldsmobile. Investors in this crowded trade simply aren’t as diversified as they think.
Perhaps a better cross-section of big business in America would be a newly constituted “S&P 494.” This is especially relevant during a time when large-cap index funds are popular 401(k) plan options for employees attracted to low fees and a perception that “buying the market” guarantees performance—and with less risk. Here we have a self-fulfilling prophesy—a situation where the same stocks are bought and therefore bid up by virtue of investor demand as opposed to company fundamentals. Prices and valuations increasingly become disconnected from reality.
This dominance has turned longstanding performance patterns upside down. In the 10 years ended Sept. 30, 2020, the S&P 500 averaged a 13.74% gain annually compared with 9.85% for the Russell 2000 index and 7.09% for the Russell 2000 Value index. And yet, according to Ibbotson’s 2020 SBBI Yearbook, one dollar invested in small value stocks at the end of 1926 grew to approximately $290,000 by the end of 2019. Alternatively, one dollar invested in large value, small growth or large growth stocks at the end of 1926 grew to approximately $35,000, $6,000, and $3,000, respectively, by the end of 2019.
Fantastic futures
But where others see pain, we see gains. An amalgamation of powerfully one-sided influences and outcomes is telegraphing the future. What worked over the past decade is unlikely to work over the next. With so many anchored to the here and now, the opportunity to profit from today’s orphaned value stocks is great. In 14 of the last 14 economic recoveries, value led the way, across all sectors. Moreover, value has performed well in periods when profits and interest rates are both accelerating. Meanwhile, overly pessimistic views for value versus rosy expectations for growth make for easier comparisons.
Ten years from now, we posit, value shares will have trounced growth, and smaller companies will outperform their larger-cap brethren, as the global economy recovers, demand grows, interest rates rise and at the very least, we experience a healthy dose of mean regression. Now is the time to buy value. And keep in mind, when the tables turn, collateral damage is inevitable. There are times when great companies aren’t great stocks. This is one of them.
Just as multiplying two negative numbers creates a positive in math, the swarm of adverse forces acting against value investing appears to be foreshadowing better days ahead. This point of view might seem counterintuitive during a time when everything is going right for growth stocks. But with history as our guide, the extremes are now so excessive that all of the minuses are beginning to look like one big plus.
Dow Jones & Company, Inc.