

RON MEISELS
Oct. 29, 2020
To clarify the current status of the U.S. and Canadian markets, and the continued existence of a bull market, this report will break down our forecasts into three parts: Long-term (many years), mid-term (1-2 years) and short-term (1-2 months).

The long-term suggests that both the U.S. and Canadian markets are in a bullish phase that commenced in March, 2009. In other words, despite the March 2020 “flash crash” that caused a 35-per-cent decline in the S&P 500 Index (SPX) and a 38-per-cent decline in the S&P/TSX Composite Index (TSX), the North American markets are in a bull market. I am very much aware that the February-March decline of 35 per cent was greater than the designated 20-per-cent level for a bear market (I could never understand why a bear market should be declared because of a certain number), I am convinced, as described in my article in the Globe and Mail on June 4, 2020, that the February-March action was a “flash crash” similar to the 1987 “flash crash” and not a bear market.
There are three important observations for the continued existence of the bull market that began in 2009:
1) All previous bull markets (using data from 1740) have lasted well over the current eleven years; the average is 24.6 years. The previous secular bull market (from 1974 to 2000) lasted 26 years. 2) It is inconsistent to maintain that the SPX is in a bear market when it has recently reached an all-time level, almost 4-per-cent higher than the February high, and 3) it is hard to believe a bearish status when day-by-day there are hundreds and hundreds of stocks in New York (not ETFs or Preferred shares) that reach new 52-week highs.
2) It is inconsistent to maintain that the SPX is in a bear market when it has recently reached an all-time level, almost 4% higher than the February high, and
3) It is hard to believe a bearish status when day-by-day there are hundreds and hundreds of stocks in New York (not ETFs or Preferred shares) that reach new 52-week highs! The long-term outlook suggests that we are 1/2 to 2/3 along the way in this bull market. The recent rise in the price of Gold and other material stocks is one of the typical signs of having moved past the half way mark of the bull market; the weakness in Financial stocks is the other (they lead at the beginning of a bull market and start to lag midway).
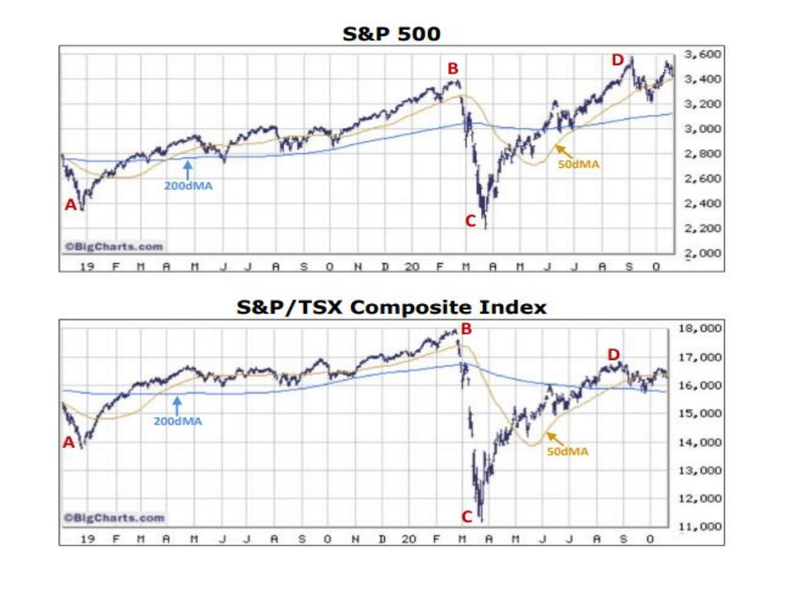
The mid-term picture (see two charts below) begins in December 2018 (A) with the relentless rise from the SPX 2,350 and TSX 13,777 to 3,389 and 17,971 by February 2020 (B); the sharp “flash crash” to 2,192 and 11,173 by March 23rd, 2020 (C); and the quick recovery to the recent highs of 3,588 and 16,831 in late August (D). (Sell in May and go away certainly did not work for the last 2 years.)
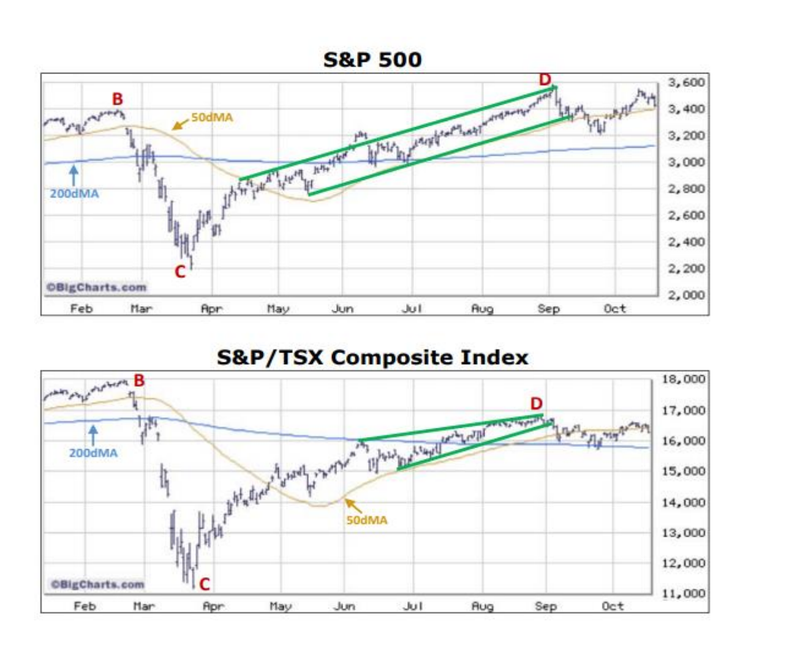
The short-term picture begins at the September 2nd high (D). At that time, the SPX had an overbought condition: the SPX was 12% above its 40- week Moving Average (40wMA), over 73% of the SPX stocks were above their 10-week Moving Averages (10wMA) and over 60% of Market-letter writers (courtesy of Investors Intelligence) were bullish. Almost instantly, both the SPX and the TSX broke below their respective up-trend channels and a sell-off commenced towards 3,430 (TSX-15,800).
The sell-off did not correct the over-bought conditions, it did not reach the 1/3 correction targets of 3,125 (15,000), but instead it gave way to a rise toward 3,540 (16,550) by October 12th. In fact, the conditions that existed on September 2nd remain the same as of today. This is a problem, since over-bought conditions can become even more over-bought, but sooner or later they will give way to a neutral and then an over-sold condition. Short-term outlook: there is a plethora of conflicting signals about the next two months.
Although Mr. Biden is leading, anything could happen (see 2016). Would Mr. Trump concede if he lost? A recount could take us into 2021! I don’t think that I have seen a similar “anything could happen” scenario in the thirty years of publishing the Phases & Cycles’ Market Comment. However, as a Technical Analyst I must rely on the existence and use of the numerous reliable indicators: one of which suggests an important low point for the coming two weeks (the end of the usually negative September-October period); and the other (“the trend is your friend”) which suggests that the current long term bull market will continue into 2021.
This Globe and Mail article was legally licensed by AdvisorStream.
© Copyright 2024 The Globe and Mail Inc. All rights reserved.