

By TIM SMITH | Reviewed by CHARLENE RHINEHART
Oct. 30, 2023
Market sentiment refers to the overall attitude of investors toward a particular security or financial market. It is the feeling or tone of a market, or its crowd psychology, as revealed through the activity and price movement of the securities traded in that market. In broad terms, rising prices indicate bullish market sentiment, while falling prices indicate bearish market sentiment.
KEY TAKEAWAYS
- Market sentiment refers to the overall consensus about a stock or the stock market as a whole.
- Market sentiment is bullish when prices are rising.
- Market sentiment is bearish when prices are falling.
- Technical indicators can help investors measure market sentiment.

iStock-1388043020
Understanding Market Sentiment
Market sentiment, also called "investor sentiment," is not always based on fundamentals. Day traders and technical analysts rely on market sentiment, as it influences the technical indicators they utilize to measure and profit from short-term price movements often caused by investor attitudes toward a security. Market sentiment is also important to contrarian investors who like to trade in the opposite direction of the prevailing consensus. For example, if everyone is buying, a contrarian would sell.
Investors typically describe market sentiment as bearish or bullish. When bears are in control, stock prices are going down. When bulls are in control, stock prices are going up. Emotion often drives the stock market, so market sentiment is not always synonymous with fundamental value. That is, market sentiment is about feelings and emotion, whereas fundamental value is about business performance.12
Some investors profit by finding stocks that are overvalued or undervalued based on market sentiment. They use various indicators to measure market sentiment that help determine the best stocks to trade. Popular sentiment indicators include the CBOE Volatility Index (VIX), High-Low Index, Bullish Percent Index (BPI) and moving averages.
Indicators to Measure Market Sentiment
The VIX
The VIX, also known as the fear index, is driven by option prices.3 A rising VIX means an increased need for insurance in the market. If traders feel the need to protect against risk, it's a sign of increasing volatility. Traders add moving averages to the VIX that help determine if it's relatively high or low.
The High-Low Index
The high-low index compares the number of stocks making 52-week highs to the number of stocks making 52-week lows. When the index is below 30, stock prices are trading near their lows, and investors have a bearish market sentiment. When the index is above 70, stock prices are trading toward their highs, and investors have a bullish market sentiment.4 Traders usually apply the indicator to a specific underlying index, such as the S&P 500, Nasdaq 100 or NYSE Composite.
Bullish Percent Index
The bullish percent index (BPI) measures the number of stocks with bullish patterns based on point and figure charts. Neutral markets have a bullish percentage around 50%. When the BPI gives a reading of 70% or higher, market sentiment is extremely optimistic, with stocks likely overbought. Likewise, when it measures 30% or below, market sentiment is negative and indicates an oversold market.5
Moving Averages
Investors typically use the 50-day simple moving average (SMA) and 200-day SMA when determining a market’s sentiment.
When the 50-day SMA crosses above the 200-day SMA – referred to as a “golden cross,” it indicates that momentum has shifted to the upside, creating bullish sentiment. Conversely, when the 50-day SMA crosses below the 200-day SMA – referred to as a “death cross,” it suggests lower prices, generating bearish sentiment.6
Limitations of Market Sentiment
Market sentiment, though a handy tool in financial markets, has its fair share of limitations that investors and traders should keep on their radar. First off, it's a bit touchy-feely because it's prone to human emotions and quirks. Things like fear, greed, and that herd mentality can sway it pretty easily. Relying on it as your sole compass for investment decisions might not be the best move since it doesn't always give you the real picture on the asset or market's fundamentals.
Market sentiment may widely swing over short-term news and events, especially in the fast-paced, high-liquidity markets. Market sentiment can flip like a coin. When everyone's riding high on a wave of optimism, it might mean things are about to hit a peak, and the opposite's true when folks are in a doom-and-gloom mode. As a result, it has been shown that irrational market sentiment have led to larger market volatility.7
Remember that sentiment data can be a bit of a wild card. Surveys, social media input, and news reactions can be biased and all over the map. That makes it a challenge to pin down and interpret accurately as the underlying information may be wrong or misleading.
It's also important to remember that market sentiment is like a sprinter in short-term trading but not so much of a marathon runner. If you're in it for the long haul, thinking about the big picture and diversifying your portfolio, sentiment might not be as useful when deploying strategies such as dollar cost averaging.
Real World Example of Market Sentiment
An uncertain economic outlook has led to sharp bouts of volatility in stock markets over the past year or so and lots of swings between bullish and bearish sentiment.
As you can see in the chart below, fear picked up among equity investors at various points throughout 2022, leading to the kind of intraday volatility in the S&P 500 not seen since the Great Recession of 2008. High inflation and central banks' response to it were mainly to blame. In the traditional economic cycle, when interest rates start rising significantly, it’s only a matter of time before the impact of higher borrowing costs causes a recession.8
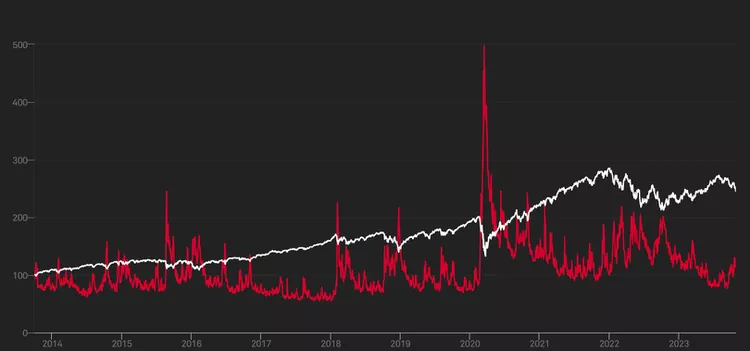
VIX vs. S&P 500.
Many investors panicked that the economy was about to crash and started selling. However, there were also a handful of others who sought to capitalize on these jitters, believing that a recession would be averted.
Gradually, the economic doom and gloom subsided. During the course of 2023, economists grew increasingly more confident that the year wouldn’t end in recession and market participants, keen to profit from equity markets being priced to reflect an economic meltdown, quickly turned bullish. The S&P 500 began its ascent again and the VIX gradually dropped.
By September 2023, volatility, as measured by the VIX, was at a three-year low. That suggests nerves are calmer and investors are happier to stick with their convictions. It’s unlikely this state of calm will last, though. Inflation continues to be higher than normal. And the longer that borrowing rates remain high to tackle this, the more damage it will cause. In other words, the economy isn’t out of the dark yet.
Uncertainty breeds volatile market sentiment and heightened reactions. After rallying since March, valuation multiples are now pricing in much more optimism. This means just the slightest hint of bad news could turn the bulls bearish again.
How Do You Identify Market Sentiment?
Investors use various indicators to measure market sentiment. Popular sentiment indicators include the CBOE Volatility Index (VIX), High-Low Index, Bullish Percent Index (BPI), and moving averages.
What Are the Different Types of Market Sentiment?
Market sentiment is typically described as bullish or bearish. Bullish means optimistic and bearish means the opposite.
What Is Bullish Sentiment in the Market?
Bullish sentiment means investors are confident about the future. This is reflected in rising asset prices. When investors feel bullish they buy, believing that the asset they bought will be worth more later.
The Bottom Line
Market sentiment is the way investors as a whole feel about a particular security, sector, asset class, or the entire financial market. Sentiment is driven mainly by the prices assets trade for relative to expected future profits. Emotion plays a big role, too.
Generally, rising prices indicate bullish market sentiment, whereas falling prices indicate bearish market sentiment. Some investors trade against the crowd. Others try to make money off the continuance of the current trend.
ARTICLE SOURCES
Investopedia requires writers to use primary sources to support their work. These include white papers, government data, original reporting, and interviews with industry experts. We also reference original research from other reputable publishers where appropriate. You can learn more about the standards we follow in producing accurate, unbiased content in our editorial policy.
- CNN. "Fear & Greed Index."
- Fidelity. "Bear vs. Bull Market."
- Cboe Exchange. "CBOE VIX Index,"
- StockCharts. "High-Low Index."
- StockCharts. "Bullish Percent Index."
- Binance Academy. "Golden Cross and Death Cross Explained."
- SpringerOpen. "An Empirical Examination of Investor Sentiment and Stock Market Volatility."
- LPL Research. "Is 2022 One Of The Most Volatile Years Ever For Stocks?"


Eugene Yashin, MBA, CFA®

Matthew Etter, CFP®

Steve Tuttle, MBA